Builder Debugger
Builder Debugger guide - use the visual step-through debugger to inspect node inputs and outputs, trace data flow, and diagnose issues in AI agent workflows.
The Debuggerin Builder is a troubleshooting tool that allows you to inspect and understand what happened during a workflow run.
It provides visibility into each node’s triggered actions, the data passed between them, and additional execution details - helping you pinpoint issues or verify behavior.
Purpose
Section titled “Purpose”- Review the latest values processed by each node
- Inspect the input data received by nodes
- See detailed execution logs and messages for each triggered node
How to Access the Debugger
Section titled “How to Access the Debugger”- Open Builderand load the workflow you want to inspect
- Click the Testbutton in the top toolbar to manually execute the workflow
- The Debugger tab is only available after a manual execution
- In the Test Resultspanel, click the Debuggertab
- The Debugger view will display all nodes that were triggered during the run
Understanding the Debugger View
Section titled “Understanding the Debugger View”The Debugger contains two main tables:
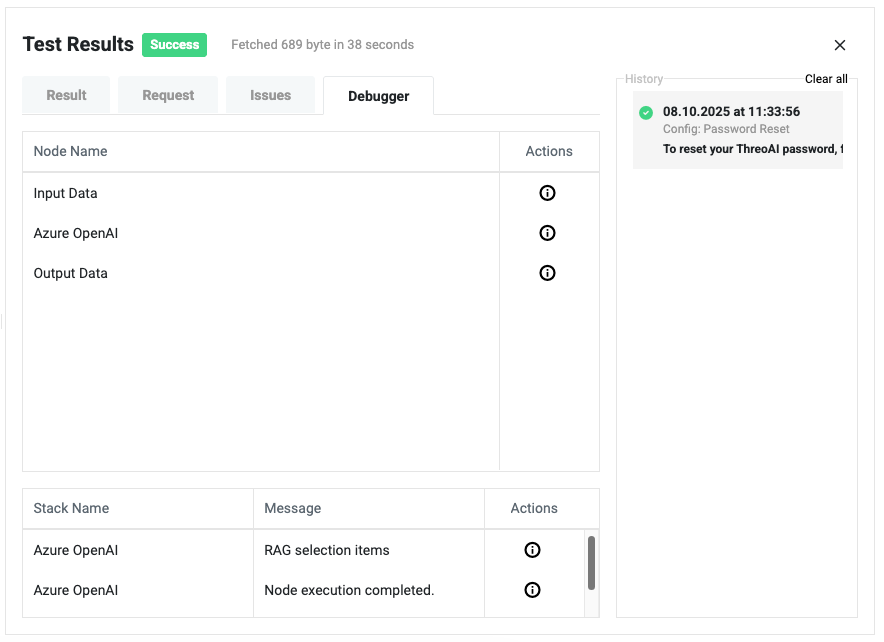
1⃣ Node Execution Table
Section titled “1⃣ Node Execution Table”Shows all nodes that were triggered in the workflow.
| Column | Description |
|---|---|
| Node Name | The name of the triggered node |
| Actions | Click the iconto view the input data that the node received |
Example:
- Input Data – Shows the initial data passed into the workflow
- Azure OpenAI – Displays the prompt or parameters sent to the model
- Output Data – Shows the final processed data before workflow completion
2⃣ Node Details Table
Section titled “2⃣ Node Details Table”Displays additional execution messages for each node.
| Column | Description |
|---|---|
| Stack Name | The node name where the message originated |
| Message | Details about the node’s execution |
| Actions | Click the iconto view more context or raw data |
Example:
- Azure OpenAI – RAG selection items: Shows the records chosen by the Retrieval-Augmented Generation process based on its understanding
- Azure OpenAI – Node execution completed: Confirms successful execution
Example Usage
Section titled “Example Usage”- Verifying Data Flow – Check exactly what data each node received during execution
- Inspecting AI Behavior – Review RAG selection items to understand why certain records were chosen
- Debugging Errors – Identify which node failed and inspect its input to find the cause
Best Practices
Section titled “Best Practices”- Always run the workflow manually via Testbefore opening the Debugger
- Use the iconto drill down into node inputs and execution details
- Review both tables to get a complete picture of the workflow’s behavior
- When testing AI nodes, pay attention to RAG selection details for accuracy checks